I have always used a REPL driven approach to Clojure development and this has been very productive, but at times I have really missed the old school approach of setting break points and stepping through code, examining variables along the way. While there are some very capable solutions that get me part of the way there (proto-repl, etc.), I was curious to see if it was possible to debug Clojure in a more traditional way. I have used debug-repl, but I wanted more control.nI learned about CIDER, but was unwilling to make the switch to EMACS (let’s just leave it at that) so I was unaware of its debugging capabilities.
In the meantime I had been teaching myself Elixir (see my previous posts) and looking to improve upon my Elixir REPL package, iex, for the Atom editor. At the same time some minor annoyances with Atom caused me to resume my never-ending quest for the perfect editor, which eventually led me to Visual Studio Code. I quickly realized that this is a great platform on which to build a debugger. Unlike Atom or Sublime Text, Visual Studio Code is designed from the ground up to be an IDE, not just an editor. It has the light weight feel of an editor, but the debugging UI is built in with API hooks to make extension to various languages relatively straightforward.
When Cursive (the Clojure environment for IntelliJ) was introduced I realized it was possible to do traditional style debugging of Clojure code, and, armed with that knowledge, I was determined to learn how to do this myself. So I have recently been experimenting with various approaches to debugging Clojure code in an attempt to build a Clojure debugger for VS Code (more on this in an upcoming post). I learned a few things along the way that might be useful for anyone headed down this path, so I’m writing this post to help them out.
I’ll talk about some of the basic concepts and APIs involved first and then I’ll present a simple project with code to demonstrate what I have learned. The project is available on github; feel free to use the code as you see fit.
Desired Functionality
Debugging is a complicated topic and there are many approaches that differ from platform to platform, so we need to define what it is we hope to be able to do.nFor my purposes, the minimum capabilities I need are
- Setting break points to stop a running JVM on a given line of code.
- Examining local variables / function arguments (the stack frame) at that point.
- Stepping over a line of code after a break point.
- Stepping into function calls after a break point.
- Resuming code execution after a break point.
Java Debugging – the Java Debug Architecture and the Java Debug Interface
It should come as no surprise that Java offers a huge and comprehensive architecture for debugging. The Java Platform Debug Architecture consists of two interfaces – the Java Virtual Machine Tools Interface (JVM TI) and the Java Debug Interface (JDI) – as well as one communication protocol – the nJava Debug Wire Protocol (JDWP). The JVM TI defines services that a VM implementation must provide to support debugging. nThe JDI defines an interface for building debuggers. Finally, JDWP defines the protocol for communication between debuggers and processes being debugged.nWe will use the Clojure Java interoperability to call the JDI from Clojure code to perform our debugging.
The JDI defines a set of Java interfaces and classes for accessing and controlling another virtual machine. The fundamental interface is Mirror. Mirrors are proxies used by a debugger to examine and manipulate the entities in another virtual machine. Arguably the most important descendant of Mirror is thenVirtualMachine interface. It provides access to the internal state of a nVM being debugged as well as methods to control that state.
You don’t instantiate a VirtualMachine mirror directly – one is returned for you when you connect to another VM. You use the VirutalMachineManager interface to manage connections to one or more VMs. The VirtualMachineManager gives you a list of connectors called AttachingConnectors that you can use to create an actual connection.
There are a lot of options regarding the connection; the debugger can launch the target VM directly, the debugger can connect to an existing VM, the target VM can attach to an existing debugger, or the target VM can launch the debugger on its own. The first two options are the most common.
In this example we will be debugging code running in one REPL by attaching to it from a second REPL, as shown in diagram 1.

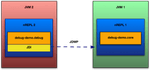
Diagram 1 – Debugging code from one nREPL using another nREPL.
We will launch one instance of nREPL in debug mode (running in JVM 1). This is the REPL in which we will run the demo code in the debug-demo.core namespace. We will launch another instance of nREPL in normal mode (running in JVM 2) and use the debug-demo.debug namespace functions to access and control JVM 1 via the JDI.
The demo code is modified slightly from the sample code generated by leiningen when creating a project with the default (library) template. It consists of a namespace with two simple functions shown below:
(ns debug-demo.core
 "Functions to use for demoing debugging.")

(defn bar
 "Returns the square of a number."
 [^long num]
 (* num num))

(defn foo
  "I don't do a whole lot."
  [^long x]
  (println x "Hello, World!")
  (let [y 4
        z 10
        w (bar x)]
   (println "y = " y)
   (println "z = " z)
   (println "w = " w)))
I set type hints on the arguments to both functions to get around a limitation in my current implementation of printing local variables. I’ll go into more detail when we look at that code.
Accessing the JDI from Clojure
Thanks to the Java interoperability provided by Clojure, we can access the JDInas we would any other library. The boilerplate setup code of connecting to a VM to create an VirtualMachine can be captured with the following Clojure function:
(defn setup-debugger
 "Intialize the debugger."
 [port]
 (let [vm-manager (com.sun.jdi.Bootstrap/virtualMachineManager)
       attachingConnectors (.attachingConnectors vm-manager)
       connector (some (fn [ac]
                          (when (= "dt_socket")
                                (-> ac .transport .name)
                            ac))
                       attachingConnectors)
       params-map (when connector (.defaultArguments connector))
       port-arg (when params-map (get params-map "port"))
       _ (when port-arg (.setValue port-arg port))]
   (when-let [vm (when port-arg (.attach connector params-map))]
     (println "Attached to process " (.name vm))
     vm)))
This function attaches to an existing VM on the given port (more about this later) by asking the default VirtualMachineManager for list of AttachingConnectors and then finding the one that provides a transport named “dt_socket”. This is the second connection option mentioned above.
It then uses this connector to connect to the target VM on the port provided. On success it prints a diagnostic message to identify the connected target VM and returns the VirtualMachine so we can use it to make debug requests. We need to add one more thing to this function to make it really useful, however. The JDI relies on events to control and monitor a VM.nEventRequests are made to initiate an action on the VM and Events are returned to indicate some action has taken place. So we need to listen for Events so we can be notified when something (like hitting a break point) has happened. We can create a new core.async thread in our setup function to listen to the event queue of the VirtualMachine. Now our startup function looks like this
(defn setup-debugger
 "Intialize the debugger."
 [port]
 (let [vm-manager (com.sun.jdi.Bootstrap/virtualMachineManager)
       attachingConnectors (.attachingConnectors vm-manager)
       connector (some (fn [ac]
                          (when (= "dt_socket")
                                (-> ac .transport .name)
                            ac))
                       attachingConnectors)
       params-map (when connector (.defaultArguments connector))
       port-arg (when params-map (get params-map "port"))
       _ (when port-arg (.setValue port-arg port))]
   (when-let [vm (when port-arg (.attach connector params-map))]
     (println "Attached to process " (.name vm))
     (let [evt-req-mgr (.eventRequestManager vm)
           evt-queue (.eventQueue vm)]
       (thread (listen-for-events evt-queue evt-req-mgr)))
     vm)))
The listen-for-events function just logs the received event for now.
(defn listen-for-events
  "List for events on the event queue and handle them."
  [evt-queue evt-req-mgr]
  (println "Listening for events....")
  (loop [evt-set (.remove evt-queue)]
    (println "Got an event............")
    (recur (.remove evt-queue))))
To test our code we start a REPL in our project directory and tell the VM to listen for debugger connections. To do this we must set the environment variable JVM_OPTS as follows:
export JVM_OPTS=-agentlib:jdwp=transport=dt_socket,server=y,suspend=n,address=8030Then when we launch the REPL we see the following:
=> lein repl
Listening for transport dt_socket at address: 8030
nREPL server started on port 64012 on host 127.0.0.1 - nrepl://127.0.0.1:64012
REPL-y 0.3.7, nREPL 0.2.12
Clojure 1.8.0
Java HotSpot(TM) 64-Bit Server VM 1.8.0_74-b02
    Docs: (doc function-name-here)
          (find-doc "part-of-name-here")
  Source: (source function-name-here)
Javadoc: (javadoc java-object-or-class-here)
    Exit: Control+D or (exit) or (quit)
Results: Stored in vars *1, *2, *3, an exception in *e

user=>
The first line about “Listening for transport” is printed by the JVM itself, not the REPL. Now we can start a different REPL (without setting
JVM_OPTS and call our setup function.
-> lein repl
lojure 1.8.0
Java HotSpot(TM) 64-Bit Server VM 1.8.0_74-b02
    Docs: (doc function-name-here)
          (find-doc "part-of-name-here")
  Source: (source function-name-here)
Javadoc: (javadoc java-object-or-class-here)
    Exit: Control+D or (exit) or (quit)
Results: Stored in vars *1, *2, *3, an exception in *e

user=>
Notice the missing “Listening for transport” message. We can then connect to JVM 1 by calling our setup function.
user=> (use 'debug-demo.debug)
nil
user=> (def vm (setup-debugger 8030))
Attached to process  Java HotSpot(TM) 64-Bit Server VM
#'user/vm
Listening for events....
We capture the VirtualMachine returned by setup-debugger in the vm var. We see the “Listening for events…” message indicating that our even handler is running. You may see the “Listening for events…” message co-mingled with the other output since the listener is running on a separate thread.
Now that we can connect to our target VM, it’s time to tackle the first of the capabilities on our requirements list, setting break points. This is accomplished by issuing a BreakpointRequest to the VirtualMachine. The primary attribute of a BreakPoint request is a Location.nInstances of Location encapsulate information about a position in the code: the source file, the line, etc.
So if we want to set a break point on a certain line in a given file, we need to get its Location. To do this we first need to understand something about the relationship between Clojure and Java. Clojure compiles to Java bytecode, but a line of Clojure may not correspond directly to a line of Java. In fact, a line of Clojure may compile to several lines of Java. This is to be expected as Clojure is the more expressive of the two languages. So this raises the question, n“how can we tell the VM (which runs bytecode) that we want to set a break point on a particular line of Clojure when that line may correspond to several lines of Java?” Fortunately, the Java designers realized some time ago (probably with the advent of Groovy) that people were implementing other languages on the JVM, so they came up with a way to support them called strata.
The JDI documentation has this to say about strata:
The source information for a
Locationis dependent on the stratum which is used. A stratum is a source code level within a sequence of translations. For example, say the baz program is written in the programming language “Foo” then translated to the language “Bar” and finally translated into the Java programming language. nThe Java programming language stratum is named “Java”, let’s say the other strata are named “Foo” and “Bar”. A given location (as viewed by thesourceName()andlineNumber()methods) might be at line 14 of “baz.foo” in the “Foo” stratum, line 23 of “baz.bar” in the “Bar” stratum and line 71 of the “Java” stratum. Note that while the Java programming language may have only one source file for a reference type, this restriction does not apply to other strata – thus eachLocationshould be consulted to determine its source path.
Which is a long-winded way of saying that the compilation process can preserve information form the original source language like source file and line number. Even better, when searching for a particular Location, we can specify a particular stratum to use – in our case “Clojure”.
There is no method we can call to get the Location for a given source file and line directly – we need to go through all the Locations for all the reference types in our target VM and find the one that matches our source file and line number.
We can narrow the scope a bit by only finding the locations for the “Clojure” strata. Our high level set-breakpoint function looks like this
(defn set-breakpoint
 "Set a breakpoint"
 [vm src-path line]
 (when-let [loc (find-loc-for-src-line vm src-path line)]
   (let [evt-req-mgr (.eventRequestManager vm)
         breq (.createBreakpointRequest evt-req-mgr loc)]
      (.setSuspendPolicy breq com.sun.jdi.request.BreakpointRequest/SUSPEND_ALL)
      (.enable breq))
   loc))
The first thing it does is call the find-loc-for-src-line vm src-path function to try to get the Location associated with the given source file and line number. Then it uses the EventRequestManager for the VirtualMachine to create a disabled BreakPointRequest.
It sets the thread suspend policy on the request to SUSPEND_ALL, which means stop all the threads in the VM when we hit the break point. Alternatively we could use SUSPEND_EVENT_THREAD to just suspend the thread that hit the break point.
Finally, we enable the BreakPointRequest. The find-loc-for-src-line function searches through all the reference types on the VM to find the matching location as described above. This code is rather long so I’m not going to cover it here. See the github project for the source code if you want to know the details.
To see our break point event we need to check for it in our event handler function:
(defn listen-for-events
  "List for events on the event queue and handle them."
  [evt-queue evt-req-mgr]
  (println "Listening for events....")
  (loop [evt-set (.remove evt-queue)]
    (println "Got an event............")
    ;;
    ;; New code to handle break point events
    ;;
    (let [events (iterator-seq (.eventIterator evt-set))]
      (doseq [evt events
               :let [evt-req (.request evt)]]
        (cond
          (instance? BreakpointRequest evt-req)
          (let [tr (.thread evt)
                line (-> evt-req .location .lineNumber)]
            (println "Thread: " (.name tr))
            (println "Breakpoint hit at line " line))

          :default
          (println "Unknown event"))))
    ;;
    ;; End break point code
    ;;
    (recur (.remove evt-queue))))
This will print the name of the thread where the break point event occurred as well as the line number in the source file. We will use the name of the thread later when we look up local variables. We can now set a break point in the foo function in our target REPL.
Our code found the location and made the break point request. Now if we run then
foo function we can see it pause and the event listener receives the break point event (refer to listing 1 above for the code being debugged).
Now that we have our break points working, let’s move on to the next capability, examine local variables. In order to do this we need to retrieve the stack frame for the paused thread, but first we need to get the thread reference.
For this we create the following utility function:
(defn get-thread-with-name
 "Returns the ThreadReference with the given name"
 [vm name]
 (some (fn [thread-ref]
         (when (= name (.name thread-ref)) thread-ref))
       (.allThreads vm)))
Here name is the name printed in our event handler. We can get the StackFrame object from the ThreadReference by calling its frame method. We encapsulate this in the following Clojure function:
(defn get-frame
 "Get the frame at the given stack position for the named thread"
 [vm thread-name stack-pos]
 (let [thread-ref (get-thread-with-name vm thread-name)]
   (.frame thread-ref stack-pos)))
Stack position refers to the position of the frame on the call stack. To get the locals in scope at the break point we use stack position 0. Once we get the StackFrame, we can list the local variables by calling its visibleVariables method, or we can get a specific variable by callingvisibleVariableByName(String name). We will use the first method to get all the local variables.
(defn print-locals
  "Print the local variables and their values for the given stack frame.
  This function is not robust and converts all locals to strings to print them out.
  A real API should interrogate the local to determine its type and handle it
  accordingly."
  [frame]
  (doseq [local (.visibleVariables frame)]
   (println (.name local) " = " (str local))
As the docstring states, this function does not handle variables all that well. In particular, reference objects (class instances, for example) do not print well. They are mirrored by objects of type
ObjectReferencImpl, which has a default toString method that just prints “object reference of type Long” for Long types, etc. This does not give us the actual value, so it’s not much use. To make things worse, since Clojure wraps function arguments without type hints in objects, we see a lot of ObjectReferenceImpl. This is the reason for the type hints in the foo and bar demo functions.
If we run the code, we get the following:
user=> (def frame (get-frame vm “nREPL-worker-2” 0)) #’user/frame user=> (print-locals frame) TYPE: com.sun.tools.jdi.LongValueImpl x = 4 nilWe see the type for x ls a long (mirrored by LongValueImpl) and the value is 4.nBecause we set our breakpoint before the subsequent let block we don’t seeny, z, or w yet.
Now if we want to step into or over code we need to create a nStepRequest.nThis is done in the same manner as a BreakPointRequest. We use the event request manager to create it, then configure and finally activate it.
(defn step
 "Step into or over called functions. Depth must be either StepRequest.STEP_INTO or
 StepRequest.STEP_OVER"
  [vm thread-name depth]
  (let [evt-req-mgr (.eventRequestManager vm)
        thread-ref (get-thread-with-name vm thread-name)
        step-req (.createStepRequest evt-req-mgr thread-ref StepRequest/STEP_LINE depth)]
   (.addCountFilter step-req 1) ;; one step only
   (.setSuspendPolicy step-req com.sun.jdi.request.EventRequest/SUSPEND_EVENT_THREAD)
   (.enable step-req)
   (.resume vm)))
depth should either be StepRequest/STEP_OVER (to step over code)nor StepRequest/STEP_INTO (to step into code).
After we create and configure our StepRequest we enable it and then call resume on the VirtualMachine. This moves us by one step.
We can create a couple of utility functions to make stepping over and into code easier.
(defn step-into
  "Step into called functions"
  [vm thread-name]
  (step vm thread-name StepRequest/STEP_INTO))

(defn step-over
  "Step over called functions"
  [vm thread-name]
  (step vm thread-name StepRequest/STEP_OVER))
We also need to add code to our event handler to let us know when a step event has occurred. This is necessary because we cannot issue a second step event until the pending event has been resumed.
(defn listen-for-events
  "List for events on the event queue and handle them."
  [evt-queue evt-req-mgr]
  (println "Listening for events....")
  (loop [evt-set (.remove evt-queue)]
    (println "Got an event............")
    (let [events (iterator-seq (.eventIterator evt-set))]
      (doseq [evt events
               :let [evt-req (.request evt)]]
        (cond
          (instance? BreakpointRequest evt-req)
          (let [tr (.thread evt)
                line (-> evt-req .location .lineNumber)]
            (println "Thread: " (.name tr))
            (println "Breakpoint hit at line " line))
          ;;
          ;; New code for step events
          ;;
          (instance? StepRequest evt-req)
          (let [tr (.thread evt)
                frame (.frame tr 0)
                loc (.location frame)
                src (.sourceName loc)]
            (println "At location " (.lineNumber loc))
            (println "File: " src)
            ;; Need to remove a step request or we won't be able to make another one.
            (.deleteEventRequest evt-req-mgr evt-req))
          ;;
          ;; End step event code
          ;;

          :default
          (println "Unknown event"))))
    (recur (.remove evt-queue))))
Now when we issue a step over request in our debugger REPL we see the event captured by our event listener and we see the target REPL output the result of the println on line 12.
This places us on line 15, the beginning of the call to bar in the assignment to z, the last line of the let block. I’m not completely sure of the behavior of step over when it comes to things like assignment blocks. I don’t know if it treats them as one contiguous line, or if it just stepped until the next function call (to bar). I need to get a better understanding of Clojure internals.
We can then step into the function call.
REPL 2 user=> (step-into vm “nREPL-worker-2”) nil Got an event………… At location 4 File: core.cljThis places us at line 4, the beginning of the definition for the the bar function. I’m not quite sure why it stops there and not on line 7, but we can proceed to the body of the function by executing another step over.
Now we can retrieve the local variables for the current break point in the bar function.
The last capability I needed was to be able to resume code execution after a break point. This is actually the easiest feature to implement since we are pausing all threads in the VM. The VirtualMache interface specifies a resume method that will resume any suspended threads. We wrap this in na Clojure function like so
(defn continue
 "Resume execution of a paused VM."
 [vm]
 (.resume vm))
Now we can resume our paused code.
REPL 2 user=> (continue vm) nil REPL 1 (TARGET) y = 4 z = 10 w = 16 nilConclusion
I still have some things to add to do proper Java style debugging, but hopefully this is enough to get you started. One thing to bare in mind is that Clojure is a functional language, while step dubbing is inherently imperative. So expect some oddities when stepping through Clojure code. This continues to be a learning process for me, so please leave comments as you learn more yourselves. The following is a list of things I hope to implement next.
To Do
- Better printing of reference types. Right now attempting to print a local variable that is a reference type (class, interface) simply calls
.toStringon the object, which defaults to the message “instance of Long”, etc. This is a problem because without type hints, Clojure function arguments are passed as reference types. So I need to figure out how to access the underlying value of the reference type. - Conditional break points (break points that include code to determine if the running code should stop). There is no built in functionality for this in the JDI as far as I know. The Eclipse debugger appears to store conditions as n
Strings that presumably get compiled and run after a breakpoint is hit to see if the code should resume. A similar approach could possibly work with Clojure code. - Break on exception. Break points that trigger when an exception occurs.
- Moving up and down the call stack. Would allow examining local variables in each stack frame. This is possible directly through the JDI, I just need to implement it.
- Setting watch points on variables. Also possible directly with the JDI.
- Rebinding local variables (changing values) before resuming execution after a break point. I have investigated this and the JDI does allow this, but it is poorly documented and examples are difficult to find.
Acknowledgements
Thanks go to Colin Fleming (author of Cursive) for pointers that helped get me started, and to Jason Gilman (author of proto-repl) for advice along the way. Also thanks to Wayne Adams for his informative blog post on using JDI to debug Java programs. I also learned a bit from reading about CL-JDI and through many JDI examples here.